
Welcome to the ORATS earnings report where we scan for companies with upcoming earnings announcements, check out historical earnings information, and find a potential options trade.
Consumer Discretionary (XLY) has been the best sector since the market’s bottom on June 16. Not all stocks have participated, though. Those with a global footprint, with particular exposure to China, have struggled to weather that nation’s strict Covid policies. After good numbers from McDonald’s (MCD) and a positive stock reaction from Yum China (YUMC), all eyes are now on Starbucks (SBUX) for the latest clues on the state of both the American consumer and those globally.
Discretionary Leads From the June 16 Market Low
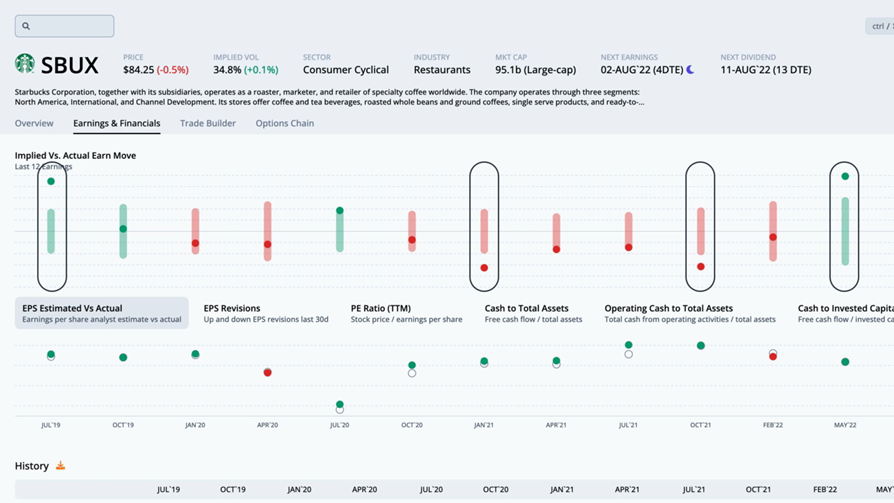
According to Bank of America Global Research, Starbucks is the world’s leading coffee retailer, with more than 29,000 locations (with total units split roughly half company-owned and half licensed). The company purchases and roasts high-quality whole bean coffees and sells them, along with fresh, rich-brewed coffees, Italian-style espressos, teas, cold-blended beverages, and complementary foods. Starbucks has recently expanded beyond its core retail business into consumer products leveraging the strength of its brand equity.
The Seattle-based $97 billion market cap Consumer Discretionary stock, listed on both the Nasdaq 100 (QQQ) and S&P 500 (SPY), features a P/E ratio near 25.4 times last year’s earnings, according to ORATS, which is 46.4% under the average for the last twelve earnings observations.
Robust EPS growth through 2024 may warrant an above-market earnings multiple. BofA sees profits rising more than 35% next year after a big 2022 drop. The stock yields 2.3%, according to The Wall Street Journal.
SBUX: Earnings, Valuation, Dividends
As a result of this year’s expected earnings decline, Starbucks’ forward P/E ratio is lofty near 25 times. That’s actually on par with other restaurant stocks.
Above-Market Earnings Multiples in the Restaurants Industry
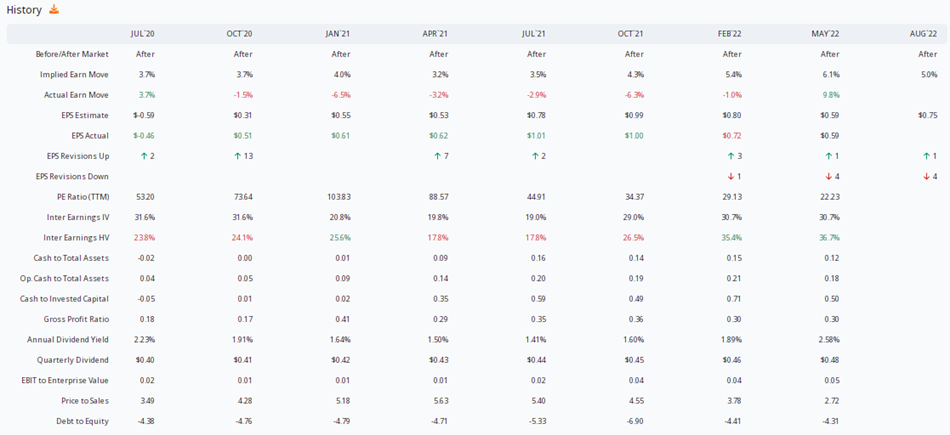
ORATS shows a $0.75 consensus earnings estimate for Starbucks’ reporting date confirmed for Tuesday, August 2, AMC. That would be a whopping 26% year-on-year net income per share drop. Higher labor costs and certainly the Covid-related shutdowns in China weigh on firm profits. Since the May quarterly report, there have been four analyst downgrades of the stock with just a single upgrade. On the upside, SBUX has beaten analysts’ estimates in seven of the past eight earnings reports, according to ORATS data.
Starbucks Earnings Date Options Color
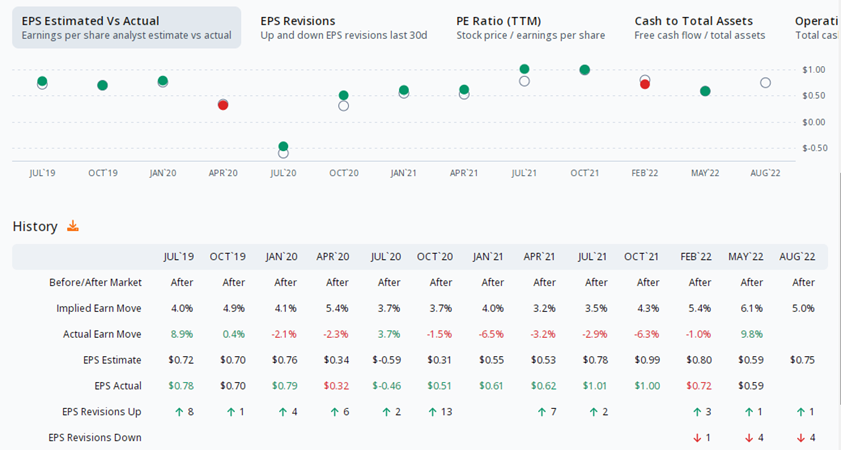
The options market expects a move of 4.9% in either direction. This move was breached in 4 out of the last 12 earnings.
Historical Implied Moves vs Actuals
During that time, the post-earnings move was outside of the implied range 4 times. In those cases, long straddles were profitable. The rest of the earnings moves likely yielded profitable short straddles.
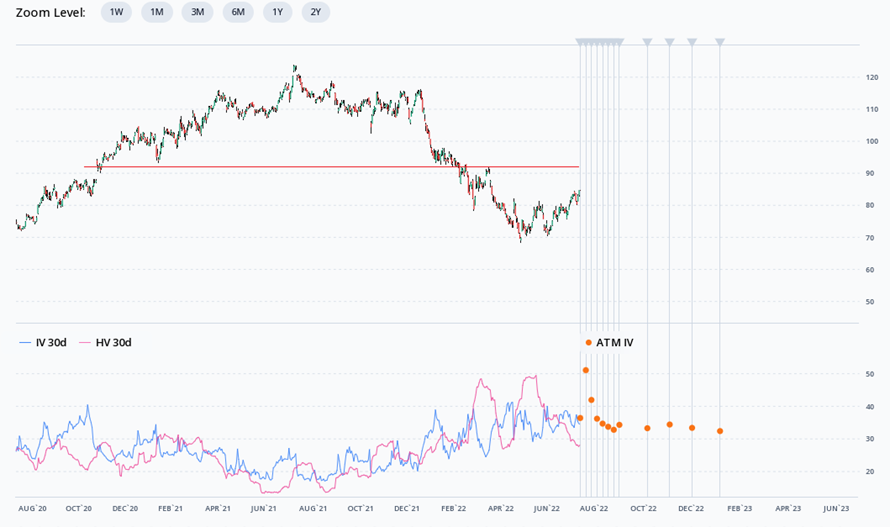
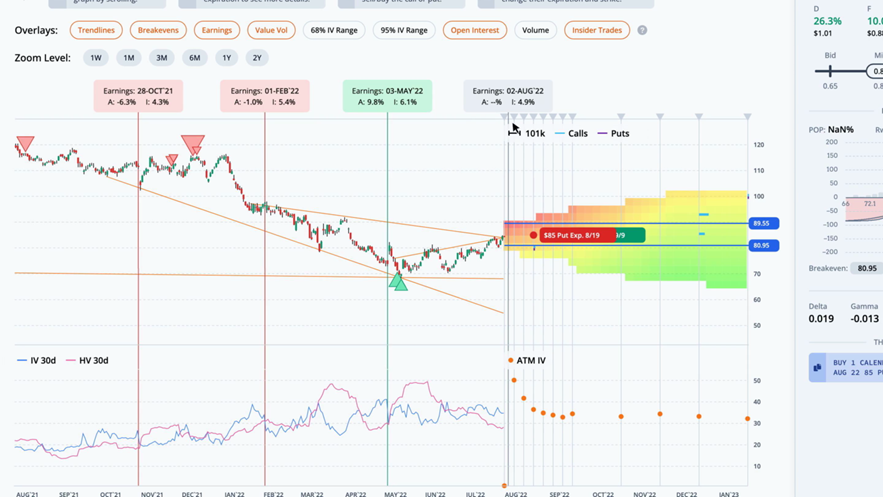
The Technical Take
SBUX recently broke above key resistance in the low $80s to climb near $85 late last week. Next resistance comes into play around $93 – the late March peak (and an old gap fill) before shares plunged below $70 during the worst of China’s Covid lockdowns. That high $60s range was important from late 2018 through mid-2020 (sans the Covid Crash). Keep these price levels in mind around Tuesday night’s earnings announcement and stock price reaction.
SBUX Resistance Near $93 Caps Upside
The Options Angle
ORATS quantitative analysis finds that the highest ranked trade is a Long Put Calendar with strikes at 85, expiring on Friday, September 9th and Friday, August 19th, for a debit of $0.78. This is a play on the stock indeed finding resistance in the low $90s and pulling back to the $85 strike.
Long Put Calendar Play
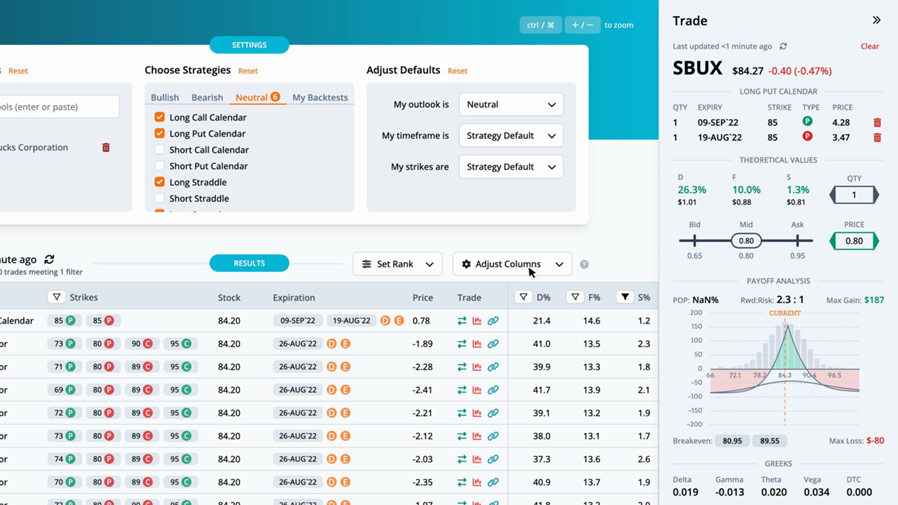
By pulling up the trade on the ORATS dashboard, we can see the theoretical values in more detail. The distribution edge, found by the expected value of the payoff picture on the stock’s historical distribution, has an edge of 26.3%. The forecast edge, which is derived from historical volatility, has an edge of 10.0%. Lastly, the smoothed edge, which is calculated by drawing a best fit curve through the monthly implied volatilities, has an edge of 1.3%. The edge is relative to the mid-market price of the trade. Greater positive edges are a theoretical benefit to the trader. We can also look at the payoff graph.
The reward to risk divides the max gain by the max loss. Here 2.3:1 is the ratio of the max gain of $187 to the max loss of $-80. There are two break evens for this Long Put Calendar at $80.95 and $89.55.
Options Valuation
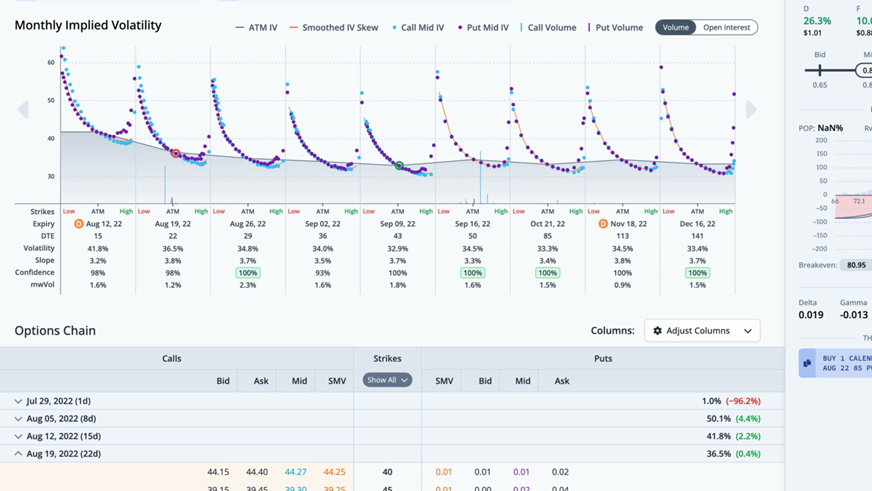
Over the last month, the stock price rose 10.3%, while the thirty-day implied volatility rose 1.5%. The average slope of the trendlines is negative. The heatmap on the right side of the graph is green where volatility and slope are undervalued, and red where they are overvalued. In this case, short-term implied volatility and slope are neutral, while the long-term is slightly undervalued.
Monthly Implied Volatility Slopes
The Bottom Line
Starbucks looks to rebound from a dismal 52 weeks. Down 31% from this time in 2021, the stock recently broke above resistance and might look to continue the uptrend after its earnings report Tuesday. But gains may be capped at $93 leading to an eventual retreat. ORATS finds that a long put calendar spread at the $85 strike using the (short) August and (long) September expirations is the optimal trade.
You can watch our full Starbucks earnings preview here. For any questions or issues with the article, please contact otto@orats.com. To subscribe to the dashboard, please visit https://orats.com/dashboard
Disclaimer: The opinions and ideas presented herein are for informational and educational purposes only and should not be construed to represent trading or investment advice tailored to your investment objectives. You should not rely solely on any content herein and we strongly encourage you to discuss any trades or investments with your broker or investment adviser, prior to execution. None of the information contained herein constitutes a recommendation that any particular security, portfolio, transaction, or investment strategy is suitable for any specific person. Options trading and investing involves risk and is not suitable for all investors.
About the Author: Matt Amberson, Principal and Founder of Option Research & Technology Services. ORATS was born out of a need by traders to get access to more accurate and realistic option research. Matt started ORATS to support his options market making firm where he would hire statistically minded individuals, put them on the floor, and develop research to aid in trading options. He is heavily involved with product design and quantitative research. ORATS offers data and backtesting on a subscription basis at www.orats.com. Matt has a Master’s degree from Kellogg School of Business.